


Fully Simulated Training Data: How We’re Using Synthetic Expo Markers to Train a Network

In this post, we are excited to present how we have trained a network to identify dry-erase markers exclusively with synthetic training data and achieved comparable results to manually gathered data. GPU capacity and neural network size have increased over time, while the ability of teams to obtain the necessary quantities of training data has stagnated. Furthermore, data collection and labeling is an expensive process, and the result may not be satisfying, especially in pixel-wise tasks such as segmentation. In some tasks, it’s almost impossible for humans to extract labels such as depth map or surface normal map.
Despite these challenges, there is still skepticism about the ability of synthetic or simulated data to achieve strong training results. This is Part 1 in a series of research papers that will explore the effectiveness of training networks with synthetic data and generalization to other training environments and applications.
In particular, we are sharing our results from using purely synthetic and a mixture of synthetic and manually gathered training data to train a network in object detection/segmentation of custom objects (object classes that have a single 3D and texture form). Expo Markers were chosen for this task because of their standard texture, size, and 3D shape. An additional advantage is the availability of this object in offices around the world, making them easy for testing and validating results. This same methodology can be used for any type of custom object.


Read our eBook on the Power of Synthetic Data: Everything You Need to Know
In This Article
This project includes the following elements:
- Our white-paper presenting our motivations, methods, and findings.
- The synthetic dataset of 5000 images here and here, which was used as training data. We are glad to be able to make this dataset free for non-commercial uses. You will also have the option to download a real dataset of 250 manually labeled images, used for testing, as well as pre-trained weights.
- Our code, which enables ‘plug and play’ training and evaluation of Mask R-CNN and Faster R-CNN using the detectron2 framework. You can go over our friendly Colab Notebook that includes visualizations and shows how to use the code.
In order to evaluate the quality of our synthetic data, we have manually gathered two additional real datasets, which we call “Real A” and “Real B”. The first dataset – “Real A” – was used for evaluation purposes only. The second dataset – “Real B” – was used both for training and evaluation. As we will see later on, using 2 different datasets for evaluation enabled us to assess the networks’ ability to cope with different levels of domain gaps.
Evaluating the results with images both from Real A and Real B enables us to assess the network’s generalization capabilities. Indeed, the Real B test set assesses performance in case of small domain gap since the images for evaluation are from the same dataset that was used for training, and the Real A dataset simulates a larger domain gap, since the images for training were taken in different conditions from those taken for evaluation (different devices, environments, etc…).
During our experiments, we used the datasets for 3 possible usages: training, validation and test. Each data point was used for one purpose only.
| Dataset Name | Size | Type | Usage |
|---|---|---|---|
| Synthetic | 5,000 | Synthetic | Training |
| Real A | 250 | Manually-Gathered | Evaluation |
| Real B | 1,000 | Manually-Gathered | Training and Evaluation |
Synthetic


Real A


Real B


Figure 2: Expo Datasets.
Our Approach: Domain Randomization + Distractions
When using synthetic data as the source domain (aka training data) and real-world data as the target domain (for testing), it is not obvious that you can achieve satisfying results. The problem arises from the so-called “data distribution gap. We would like there to be maximal overlap between the source and target domains, allowing the trained network to generalize well when presented with the testing data. Since we can only control the source distribution, how can we maximize the overlap when we can only control this one domain? One strategy is to make the source variance broad enough that the target domain will be contained within it. This approach is called Domain Randomization. The second approach is to make the source domain similar to the target domain. The main method of accomplishing this is called Domain Adaptation.
In our synthetic dataset, we chose to pursue the Domain Randomization approach. We took photorealistic models of Expo Markers and randomized them in nonrealistic ways to force the neural network to learn the essential features of the object of interest. The data creation process results in scale variation, occlusions, lighting variation, high object density, and similar object classes, we added large numbers of other distraction items, using other simulated assets in our library.
(DR illustration) https://lilianweng.github.io/lil-log/2019/05/05/domain-randomization.html
Results
To measure how well our synthetic dataset trained the network to perform instance segmentation on real images, we used mAP (click for more details about the metric) at different IoU thresholds as our metric.
At a high level, mAP (mean average precision) measures how accurate your predictions are. i.e. the percentage of your predictions that are correct.

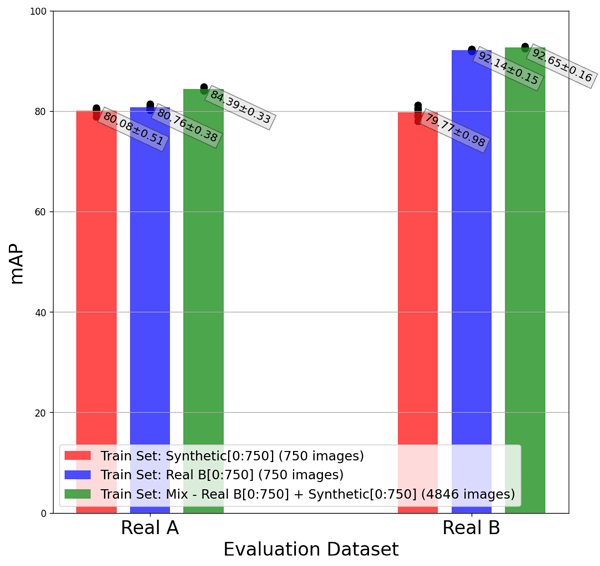
As shown in the graph below:
- The networks that were trained on Synthetic and on Real B achieved approximately the same performance when evaluated with Real A (80.08 and 80.76 respectively).
- About 5% of performance improvement was observed when the network was trained with a mixture of Synthetic and Real B and then evaluated on Real A (relative to training with only Synthetic or only Real B and then evaluating on Real A).
The evaluations on Real A and Real B can teach us about two different possible real world scenarios:
- The first scenario is when the training data and evaluation data are coming from different sources. Indeed, when training on Real B and evaluating on Real A, we are assessing the network’s ability to cope with data that was taken from a different domain (different environment, capturing device, etc…) than the evaluation set. This setup is more challenging, but reflects more closely industry use-cases where the production environment often looks different than the training environment, and enables a fairer comparison between synthetic and manually gathered in terms of ability to generalize to unseen real-life scenarios.
- The second scenario is when the training data and evaluation data are coming from the same source. Indeed, when training on Real B and evaluating on Real B, we are comparing synthetic data to manually gathered data that was taken from exactly the same distribution (Real B was randomly splitted into train, validation and test). This setup represents a less common use-case of what we see in the industry, but enables us to challenge our synthetic data in a case where real data has a clear advantage.
In the first case, we observe that the synthetic data achieves comparable results to the real data (mAP=80.08 v.s. mAP=80.76). In the second case, the synthetic data alone still achieves satisfactory results (mAP=79.96), although not surprisingly, the real data achieves higher results (mAP=92.14). Taking into account that the training set has the same data distribution as the evaluation set, we can see that benchmark as an upper bound in terms of data generalization ability. In both cases, training with a mixture of synthetic data and real data improved the results compared to training only with one of them. While when evaluating on Real A the improvement of training with mixed data is more significant.
| Train | Evaluation | Description | mAP | mAPIoU=0.5 | mAPIoU=0.75 |
|---|---|---|---|---|---|
| Synthetic | Real A | Synthetic to Real | 80.08 | 97.87 | 94.41 |
| Real B | Real to Real (different domains) | 80.76 | 96.28 | 94.55 | |
| Synthetic + Real B | Mix to Real (unknown domain) | 84.38 | 99.35 | 97.84 | |
| Synthetic | Real B | Synthetic to Real | 79.76 | 94.16 | 88.73 |
| Real B | Real to Real (same domain) | 92.14 | 99.33 | 97.73 | |
| Synthetic + Real B | Mix to Real (known domain) | 92.65 | 99.47 | 99.17 |
Read our eBook on the Power of Synthetic Data

Roey is a Computer Vision Algorithm Engineer at Datagen
Read More
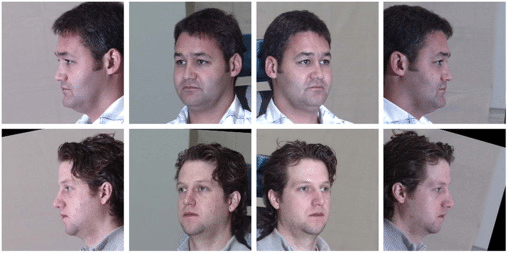
The State of Facial Recognition Today
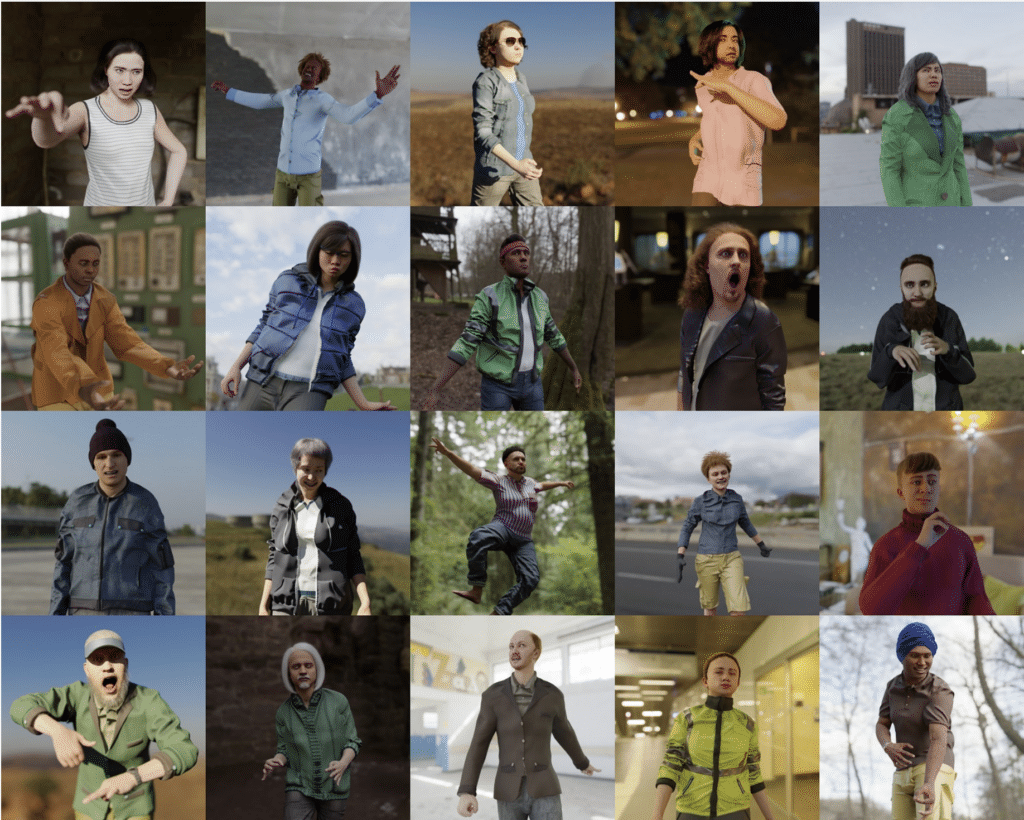
Procedural Humans for Computer Vision