


Preparing the Data for Hands-on-Wheel Detection

In our first blog, we reviewed why we chose to focus on hands-on-wheel detection and how synthetic data impacted our outcomes. Here we will discuss the data we used in our benchmark.
What data did we use?
We chose the DMD dataset as our real dataset because it contains a large number of drivers, driving scenarios, camera angles, and has a wide variety of tagged behaviors, including whether or not the hands are on the wheel. We split the dataset into a train, validation, and test sets based on the identity of the drivers in the dataset. In total, the dataset contains 651k frames, of which we use 531k for training, 47k for validation, and the rest for tests. The drivers are recorded using three cameras–one facing the driver’s head, one facing the driver’s body, and one facing the driver’s hands. A side view of the wheel offered a clearer perspective whether the hands are on the wheel. The probability of left and right hands off the wheel is different. Drivers in countries that drive on the left side of the road will typically perform other actions with their right hand while the left hand remains on the wheel. This bias can be seen in Table 1.
| Left Hand | Right Hand | Synthetic | Real |
| On | On | 5,642 (50%) | 214,192 (32.8%) |
| On | Off | 3,546 (31.4%) | 304,102 (46.7%) |
| Off | On | 2,014 (17.8%) | 122,416 (18.8%) |
| Off | Off | 82 (0.7%) | 105,79 (1.6%) |
| Total | 11,284 | 651,289 |
Table 1. Label distribution in real and synthetic datasets.
Read the full benchmark report — Hands Up: Leveraging Synthetic Data for Hands-on-Wheel Detection
How did we prepare the synthetic data?
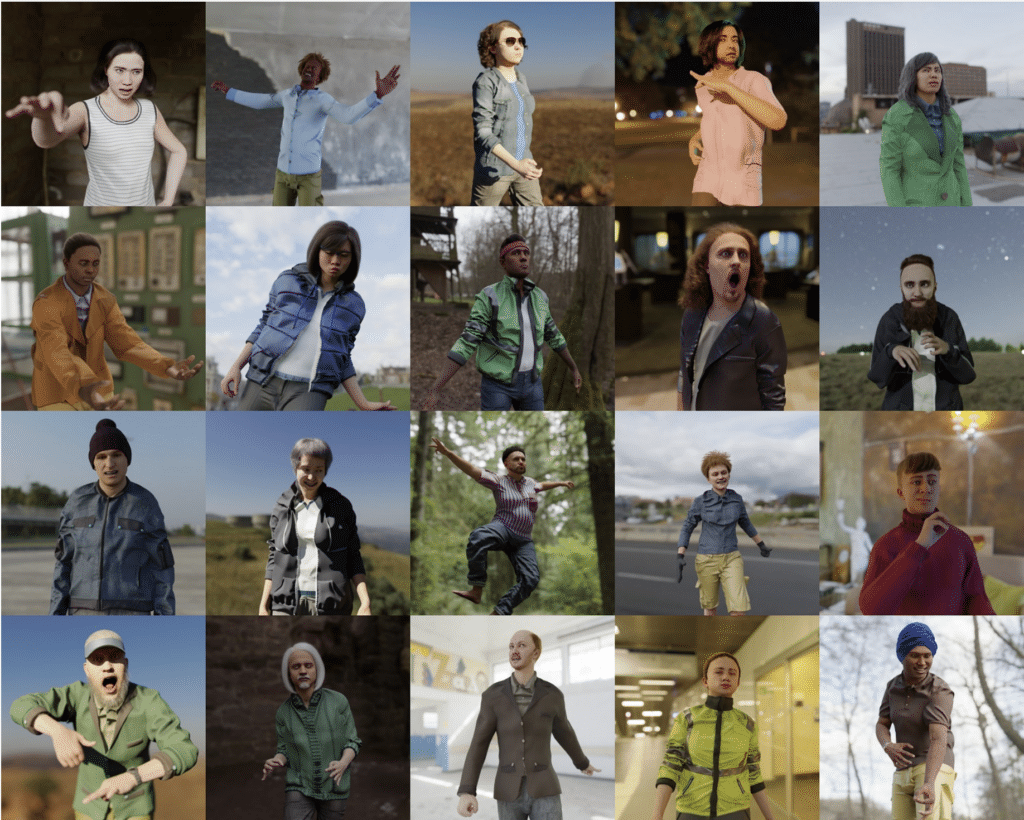
We used the Datagen synthetic data platform to generate a diverse video dataset composed of different drivers who perform various actions in different vehicles. Among the multiple camera views available, we rendered the scene using a camera focused on the driver’s body, a similar viewpoint as the real data. Each scene is 10 seconds long and is rendered at 15 frames per second. Each image resolution is 256×256 and includes hand, body and wheel keypoints. See Figure 1 for some RGB examples from the synthetic dataset.
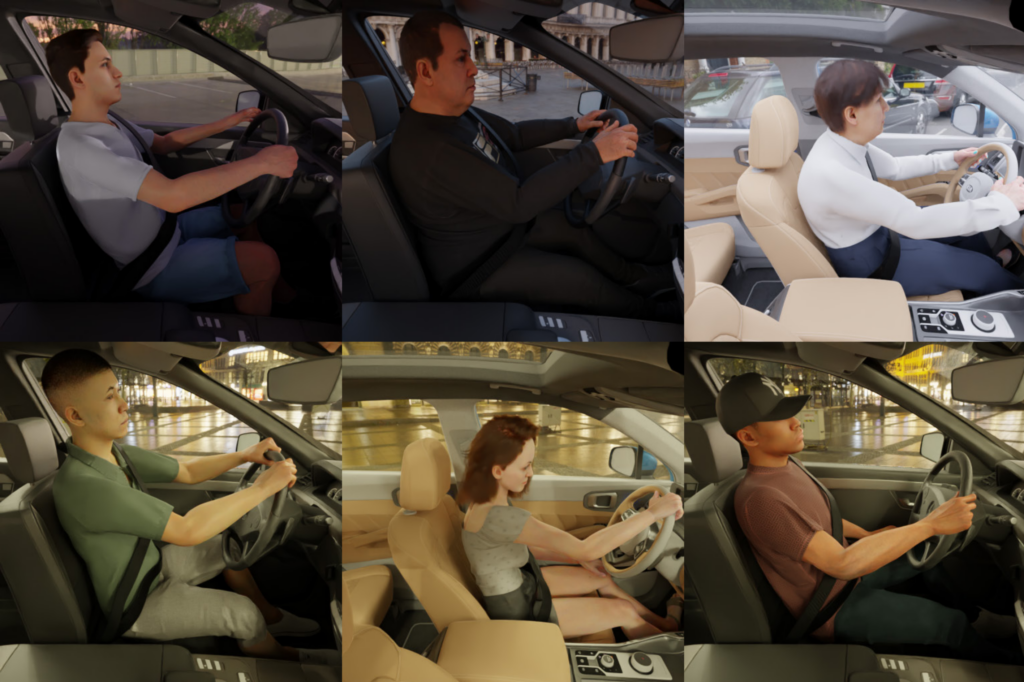
Figure 1. Sample images from our synthetic dataset
To maximize variance in our dataset we generated diverse sequences:
- Environment – Our dataset included various car types; large and medium SUVs and sedan type vehicles. The interior areas in the car differed to allow variance including seat types, wall colors and especially important for our task, different wheel types.
- Demographics – We used ten different drivers with different ethnicity, age and gender.
- Behaviors – We generated multiple behaviors such as falling asleep, turning around, texting, one handed driving, and two handed driving.
- Scene – We generated all sequences with random background and lighting conditions – daylight, evening light, or night.
In total, we generated 146 sequences.
For each frame, we separately labeled each hand as being on or off the steering wheel. The availability of 3D key points from our platform makes the hands-on-wheel labeling almost a trivial task. In total, the synthetic dataset contained 11,284 unique images. We split our train, validation, and test sets based on the driver identity. Our training set contained 8,834 images. The validation set consisted of 2,450 images following the same proportions as the train split (we undersampled both hands on wheel frames to match real data distribution).
Did we use any pre-processing?
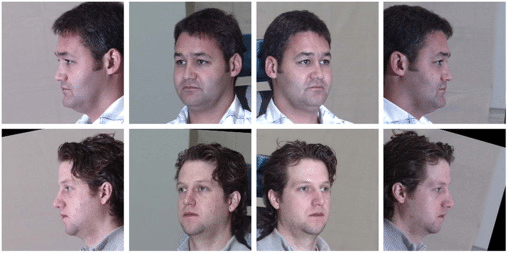
To eliminate background distractions from the model, we manually cropped both the real images and synthetic images around the wheel. Then, only the wheel and hands are visible without any extra details. See Figure 2 for some examples from the real and synthetic datasets.
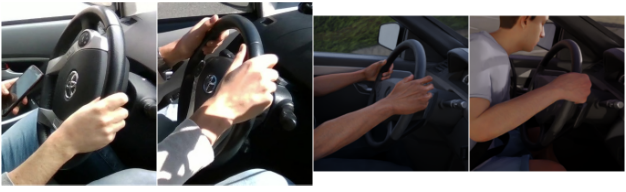
Figure 2. Examples from the real and synthetic datasets after cropping around the wheel
What was the model architecture?
We choose the lightweight MobileNetV3 architecture as the backbone for all our experiments, considering the real-time nature of our task. We replaced the classification head with two binary classification heads; each containing two fully connected layers activated with ReLU and a final fully connected layer with a sigmoid activation. The two classification heads predict, respectively, whether the left or right hand is on the wheel.
Our final blog will discuss the experiment and the results.
Read the full benchmark report — Hands Up: Leveraging Synthetic Data for Hands-on-Wheel Detection
Read More
The State of Facial Recognition Today
Procedural Humans for Computer Vision